How I Roadmap
November 11, 2018Photo credit: https://flic.kr/p/9r9JTj
A few years back, I took over an engineering team that was failing to meet the needs of their customers. One of the many complaints leveled was that the team did not effectively communicate their plans. It became apparent to me that I needed to find a way to share the work the team planned to do over the short and long term. I began searching for examples that were simple and effective. This is when I began experimenting with visual roadmaps.
There are likely many approaches to visualizing a product or team’s roadmap. What I want to share with you is an approach that I have taken over the past few years that has worked for me. I have tweaked my approach over the years, incorporating feedback from friends and peers, experimenting along the way.
Let’s take a look at an example:
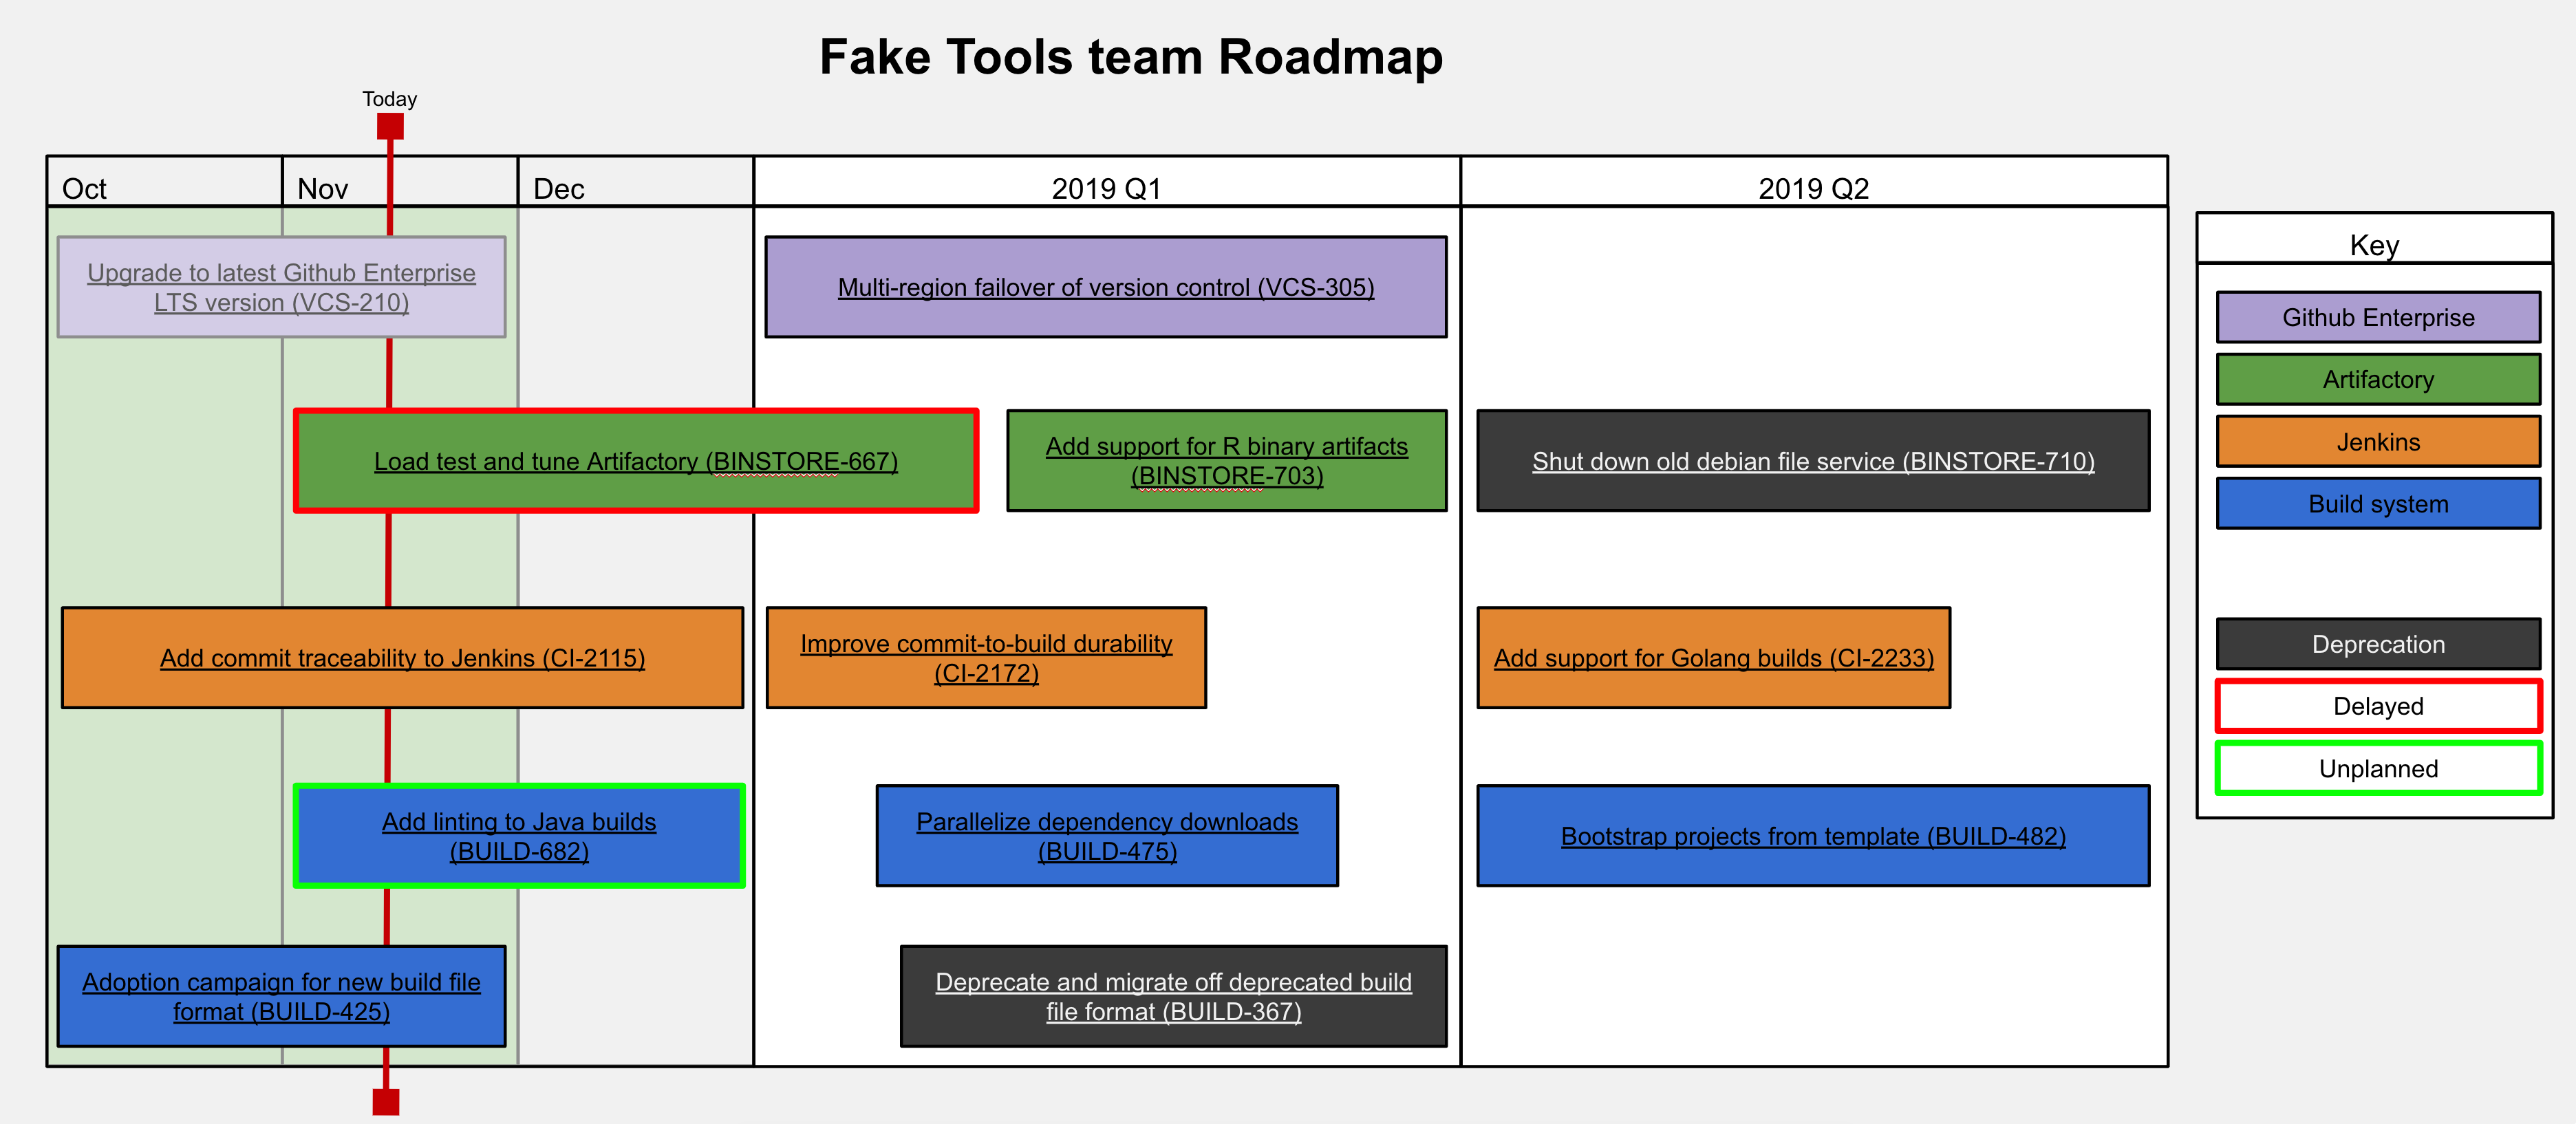
The above image shows the roadmap for fictitious tools team. As you can see from the key on the right, the team manages the companies Artifactory, Github Enterprise, Jenkins and build system. The details of the roadmap aren’t really the relevant part, but I tried to make it somewhat believable.
The rest of the post will break down elements of the roadmap and how I think about it. At the very end, I will provide links to templates you can use to create your own roadmap.
Audience
When I started building visual roadmaps, the intended audience was primarily my team’s customers. They were keenly interested in what we were working on and wanted to know where we were going. Over time, however, I was surprised to find that there were other users of the roadmaps. It now feels a bit obvious.
My team gained a lot by having a visual roadmap. During our planning meetings, we would bring up our roadmap. We would discuss the status of the work in the current quarter, as well work we had planned for the future. Being able to see three quarters worth of work in a single diagram gave us a lot more context when we had to make scheduling tradeoffs.
Additionally, I found that having an up-to-date visual roadmap streamlined our quarterly planning sessions. Why? Well because we already had a rough outline of what we wanted to do in the coming quarters. We were constantly adding and shifting work around for the next two quarters. So when it came time to put our quarterly plan together, we focused on verifying and breaking down the work that was already on the roadmap. In fact, I found that we always knew what we would be working on at any given time.
Time
My roadmaps tend to be broken up into quarters. This is because the organizations that I’ve worked at tend to have a quarterly planning cycle. The quarter on the far left is always the current quarter. I typically only include the current quarter and the following two quarters. It is hard to predict what will be working on beyond 9 months.
I like to break the current quarter down even further by month. This is to denote an increased level of accuracy that we can provide for estimates. The farther right something is on the roadmap, the less certain it is.
I also like to include a vertical line indicating the current date. This line serves two purposes. The first is to remind everybody how far we are in the quarter, obviously. The second purpose is to remind me when I last updated the roadmap. If the current date is two or three weeks behind, then I am not doing a good job updating.
Granularity
For the roadmaps I’ve built, I only include coarse grain projects or features. In the Agile community, you might call them epics, but any term you use fits. Each bar in the roadmap is effectively an epic.
Occasionally I might include a "fine grain" task on the roadmap, like an Agile story or task. This would be if this small bit of work had tremendous value and interest to my customers. Rather than forcing them to dive into our team’s backlog of tickets, I could give them some visibility on the roadmap. This is, however, rare.
Since epics tend to be large chunks of work, most of the visual blocks span multiple months.
Updates
I will only update the roadmap once every two weeks or so. I update the roadmap after a sprint is complete. I will update the roadmap with the team as well. The team is already in the planning mindset. Additionally, the probability that the results of our recent sprint will impact future work is high. Discussions we have around the roadmap are often fruitful as well.
I do spend more time updating the roadmap at the end of a quarter, but I still don’t find it excessive at all.
Color
I am a visual person. I also, like to use color. My use of color may offend you, and for that I am sorry. I want the roadmap to be bright and inviting. I could remove all the color and shift to a gray tone, but I just feel it will feel drab and unappealing. I want the mood to be light, uplifting and positive.
More specifically, I use color to denote products or types of work. You may see this from the key on the right. This makes it easier to hone in on the products or types of work you care most about.
Now, I will say that I have not accommodated those with color blindness. If this is important, I believe using swimlanes instead of color may be a better approach.
Getting details
The devil is in the details. For most of these epics, a customer or team member will want to dig in further. To address this need, I began adding links in the diagram to the specific JIRA Epic. This allows anybody to dig into all the history and notes contained in that epic. A wealth of data just a click away.
What’s nice about this approach is that the visual roadmap can be thought of as merely a representation of the epics within JIRA. Engineers might be more comfortable working with JIRA tickets, while I wanted to focus on epics. Epics became the unit of work I cared most about, and engineers knew that. By asking engineers on my team to always associate work with an epic, I could manage the roadmap more effectively. This connection within JIRA was extremely valuable for bridging the gap between coarse grain and fine grain work.
Done, Delayed and Unplanned work
When the team completed an epic, I wanted to make sure that the roadmap reflected that it was done. I personally like fading the colors and text of the epic block in the roadmap. You can see an example of this in the above example. The first epic is faded because the team completed the work. Once again, this enabled my customers and me to get the information we needed, at a glance.
Similarly, if planned work wound up getting delayed, I wanted to make sure that our customers knew. For delayed work, I merely outline the epic block in a bold red outline. I would also move the epic into what I considered a more realistic timeline. So when you glanced at the roadmap, you might see that work targeted for this quarter has been pushed out.
One quick note about delayed work. I only mark something as delayed if it was targeted for the current quarter and it won’t get done then. If I had something slated for the next coming quarter, and it got pushed even further, I don’t call that out. Why? Well, I view work beyond the current quarter as goals, not commitments. This will of course vary based on your organizational culture.
Lastly, there is a chance that something changes mid-quarter, forcing us to do work we hadn’t planned on. For this, I highlight this epic with a bold green outline. This can help tell a story as to why some other work didn’t get done. Unplanned work is inevitable.
Experiments
Previously incarnations of my roadmaps included some experiments that I thought were worth mentioning.
The first is something I already mentioned. In the past, I used swimlanes to separate types of work. For instance, I might have a swimlane called "Customer impact" and another called "Technical debt". I’ve also used swimlanes to separate out products (instead of color). I imagine swimlanes could be useful in a variety of ways but found my roadmaps were more compact without them.
Another concept I briefly experimented with was adding ownership to each epic. I would annotate each epic block with the initials of the engineer on my team who was leading this work. This didn’t necessarily mean that they were working alone, but that they owned the work. I would include a small cute bubble with their initials to denote ownership. Customers didn’t necessarily benefit from this, but the team did. It also helped me understand how to balance the ownership of work. More recently, I would manage ownership within JIRA and not on the roadmap.
Why a Google Drawing? (A short rant on tools.)
I suspect at this point, a lot of you have asked this question. "Why is Mike using Google Drawing? Isn’t there some tool out there that can do all this for him?" In short, the answer is yes there is. A ton in fact. But I have yet to try.
Why not? Well, it’s because using a drawing tool is just easier, and honestly there are very few constraints. Let me explain.
Whenever you encounter a problem, the first thing you will do is try to solve this problem with a process. Often, the process you implement will eventually be supported or enabled by a tool. For me, I wanted to solve the problem of communicating long-term plans. I decided that I would institute a process with my teams to define our long-term plans. I then decided to lean on a visual roadmap as a tool for communicating our plans. I had a problem, I found a process, and lastly a tool, in that order.
The problem with starting with a tool is that the tool has been designed to solve a problem, or set of problems, that may not be the problem you want to solve. By using a flexible tool, like Google Drawing, I’ve been able to experiment, change, and upend my whole approach with very few headaches. Put another way, I’ve been refining my process. I suspect I could implement a tool at this point since I’ve learned enough about the process I want. If you start with a tool, your process will be shaped by the constraints of the tool.
Influences
I wanted to give a shout out to the biggest influence on my roadmaps. The site that got me started was the IT Kanban wordpress site, that included a section on Strategic roadmaps. Their approach just clicked with me and my early roadmaps looked just like theirs.
Since then, I’ve had some great feedback from colleagues with a lot more product management experience than me. In particular, I want to give a shout out to Barry Hawkins for some of his feedback and insight. Thanks Barry!
Give it a shot
It’s taken me a while to get to this point, and there may be one or two of you who might want to build your own roadmaps. To help you get started, here are some links to Google Drawings I’ve built that you can try:
If you do end up building roadmaps, I would love to hear about it. If you are currently doing something else that works for you, definitely share your approach.
Share this:
comments powered by Disqus